Survival or hazard curves of simulated data
# S3 method for modSim
plot(x, ind, type = "surv", ...)
Arguments
- x
output of modelSim function (must be of type modSim)
- ind
vector (individuals to show)
- type
type of plots (survival or hazard curves)
- ...
supplementary parameters
Value
plot x
Examples
library(survMS)
ind = sample(1:500, 5)
### Example with survival data simulated from AH model
res_paramLN = get_param_ln(var=170000, mu=2325)
listAHSim_n500_p1000 <- modelSim(model = "AH", matDistr = "unif", matParam = c(-1,1), n = 500,
p = 100, pnonull = 100, betaDistr = 1.5, hazDistr = "log-normal",
hazParams = c(res_paramLN$a*4, res_paramLN$lambda),
Phi = 0, seed = 1, d = 0)
#> Warning: Options "non-linearity with interactions" not available
### Two types of plot are available (survival (by default) and hazard curves)
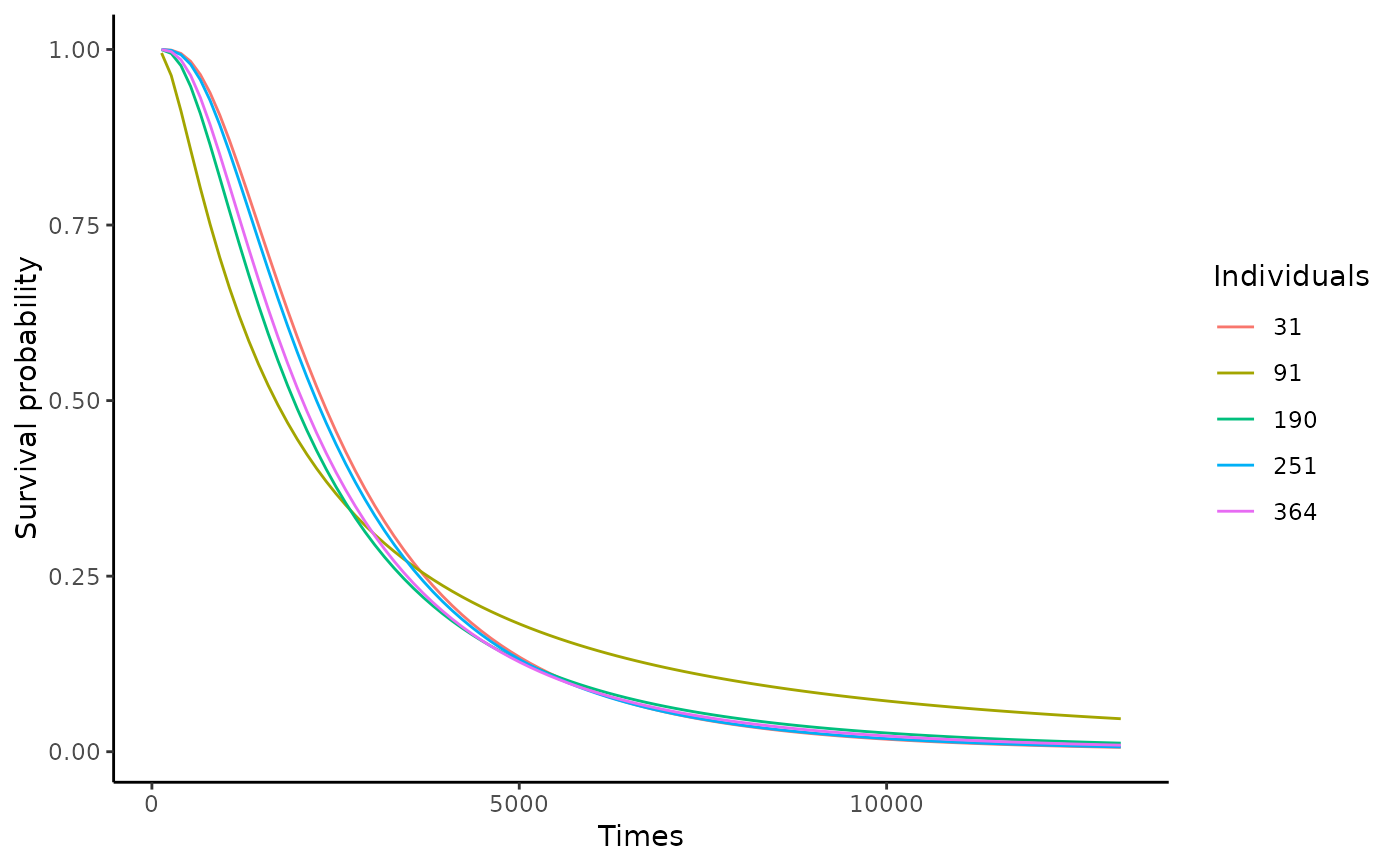
## Survival curves
plot(listAHSim_n500_p1000, ind = ind)
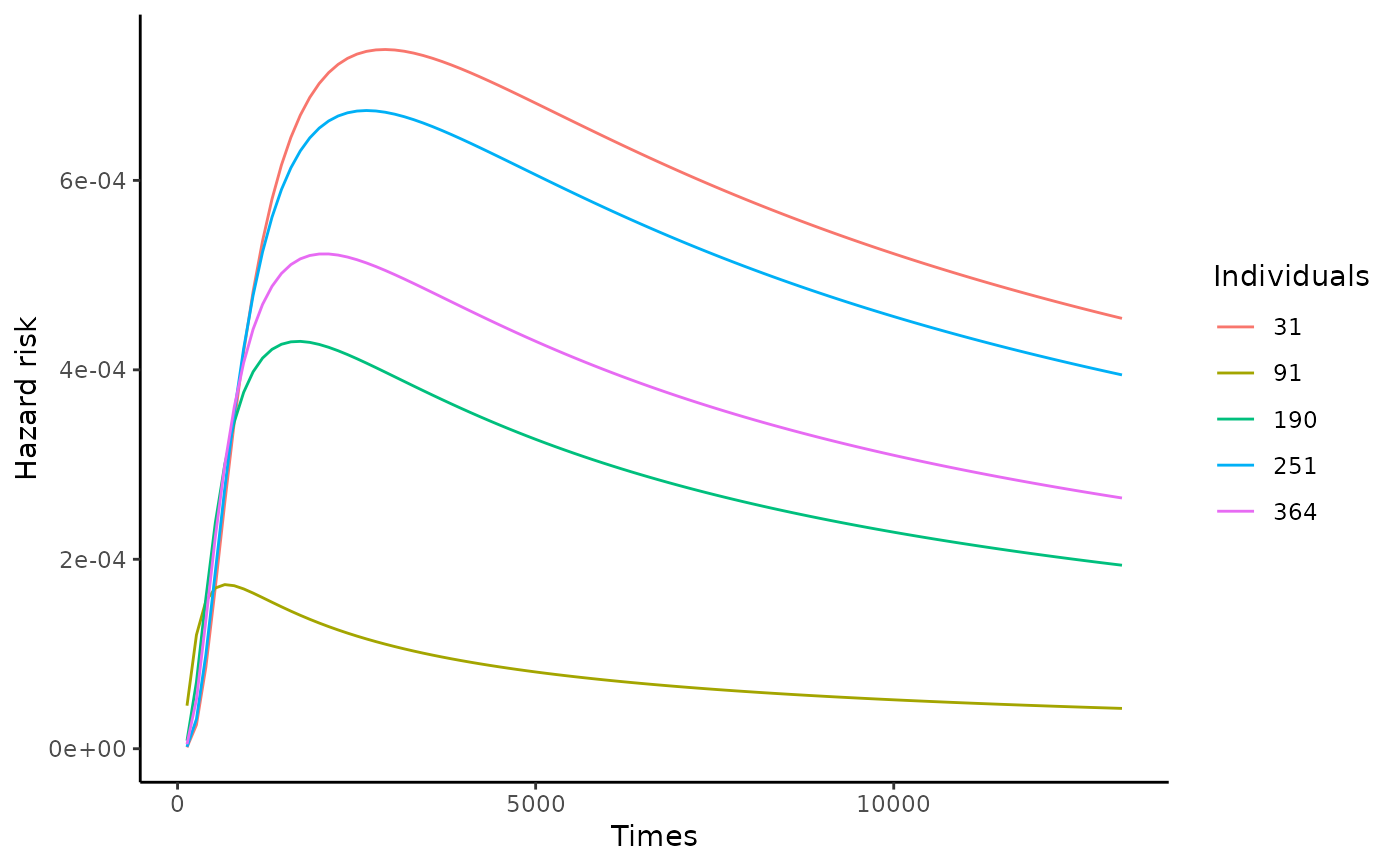
 ## Hazard curves
plot(listAHSim_n500_p1000, ind = ind, type = "hazard")
## Hazard curves
plot(listAHSim_n500_p1000, ind = ind, type = "hazard")